
|
Colour versions of Figures to accompany the paper:
Annaz, D., Karmiloff-Smith, A., Johnson, M. H., & Thomas, M. S. C. (2007). A cross-syndrome study of the development of holistic face recognition in children with autism, Down syndrome and Williams syndrome.
(This webpage is under construction)
Figure 2: Mean raw scores on the Benton Face Recognition Task (Benton et al., 1983). A restricted sample (n=18) of the TD group is depicted here, to achieve an approximate match for chronological age with the disorder groups. TD = typically developing group (mean CA=8;5); HFA = high-functioning autism (8;5); LFA = low-functioning autism (8;6), DS = Down syndrome (9;7); WS = Williams syndrome (8;9).
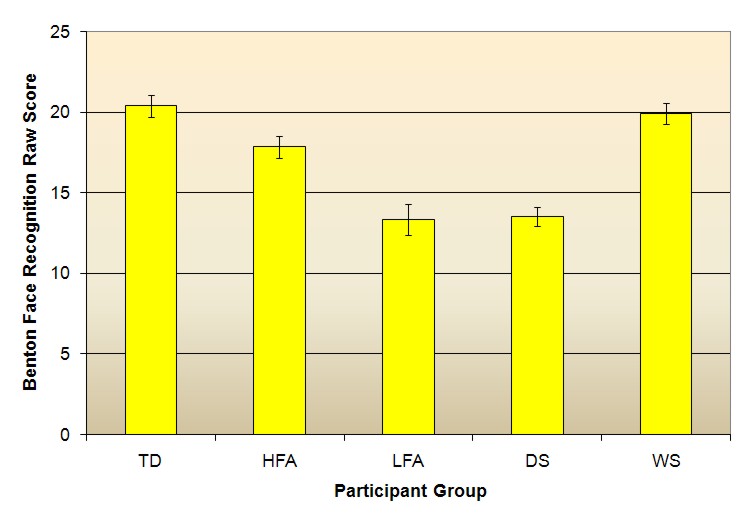
Figure 3: TD group developmental trajectories for accuracy scores on the part-whole task. R2 values indicate the proportion of variance explained by each trajectory.
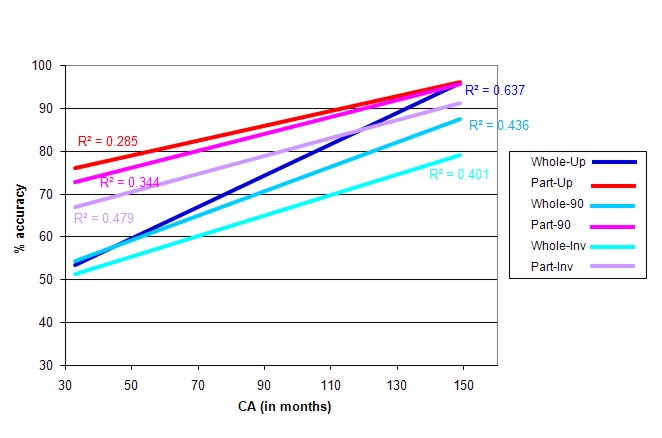
Figure 4: HFA group developmental trajectories for accuracy scores on the part-whole task. R2 values indicate the proportion of variance explained by each trajectory.
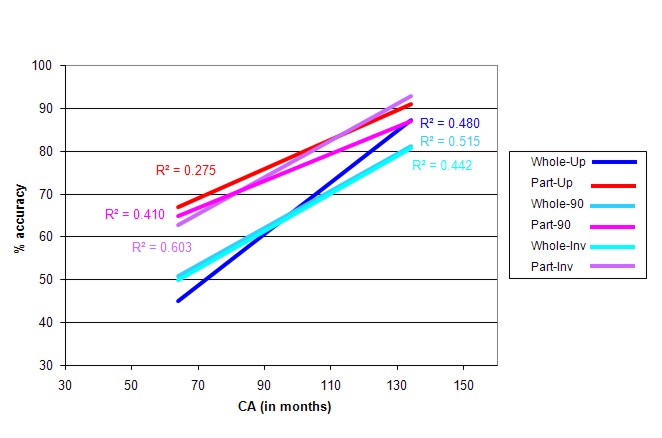
Figure 5: LFA group developmental trajectories for accuracy scores on the part-whole task. R2 values indicate the proportion of variance explained by each trajectory.
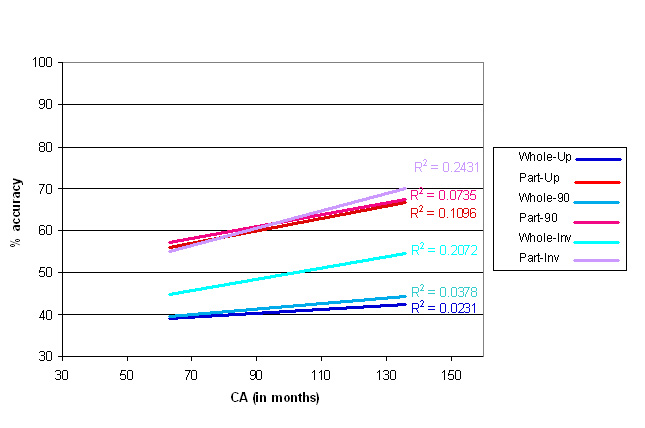
Figure 6: WS group developmental trajectories for accuracy scores on the part-whole task. R2 values indicate the proportion of variance explained by each trajectory.
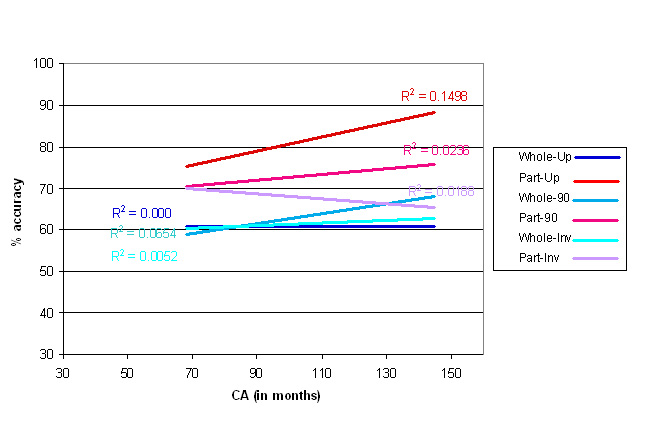
Figure 7: DS group developmental trajectories for accuracy scores on the part-whole task. R2 values indicate the proportion of variance explained by each trajectory.
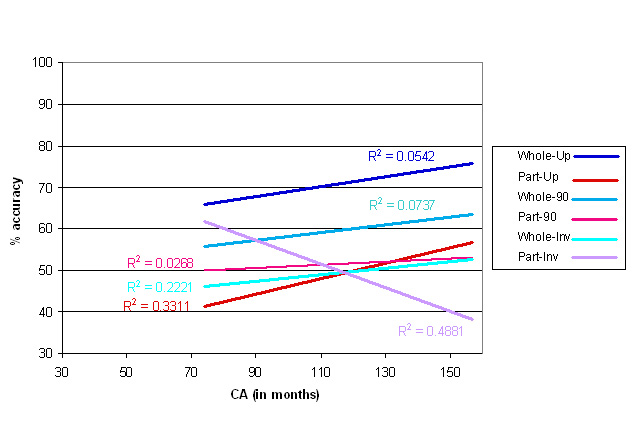
Figure 8: Trajectories for all groups when plotted against BPVS test age (Dunn et al., 1996). This is a standardised test of receptive vocabulary.

Figure 9: Trajectories for all groups when plotted against Pattern Construction test age from the BAS-II (Elliot et al., 1987). This is a standardised test of visuospatial cognition.

Figure 10. Trajectories for all groups when plotted against Benton raw score (Benton et al., 1983), a test of face recognition ability.

Figure 11. Mean accuracy scores on part-whole performance split by feature (eyes, nose, mouth), for each disorder group. [Figure not included in paper but data shown in Table 2].
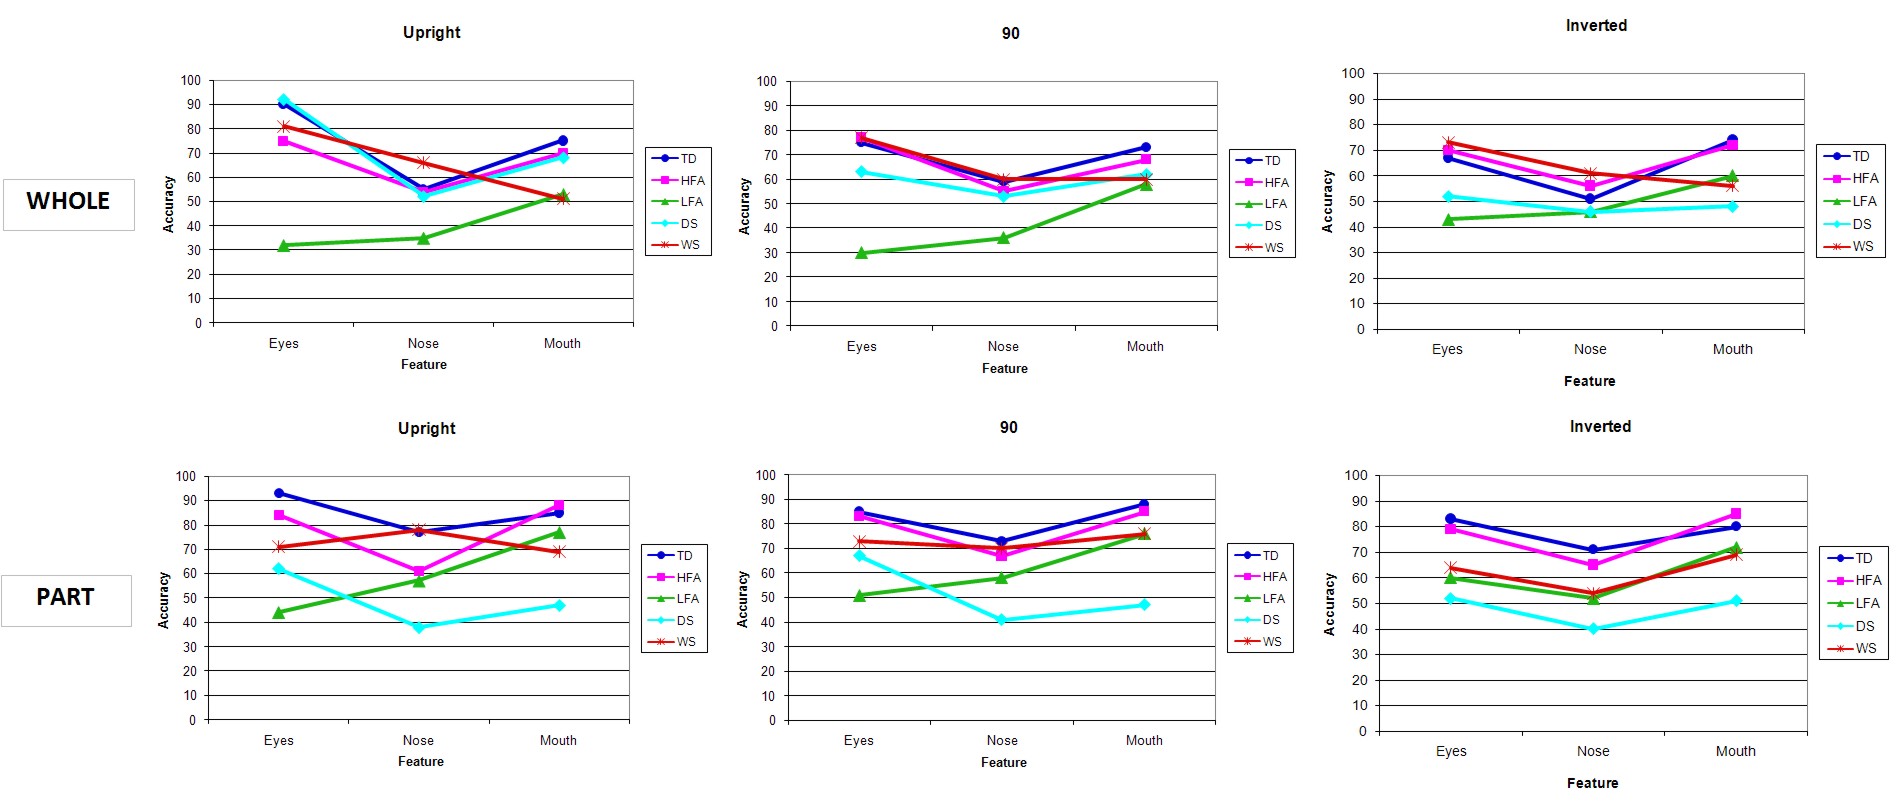
Figure 12. Benton Raw Score values for each group plotted against CA. [Figure not included in paper].
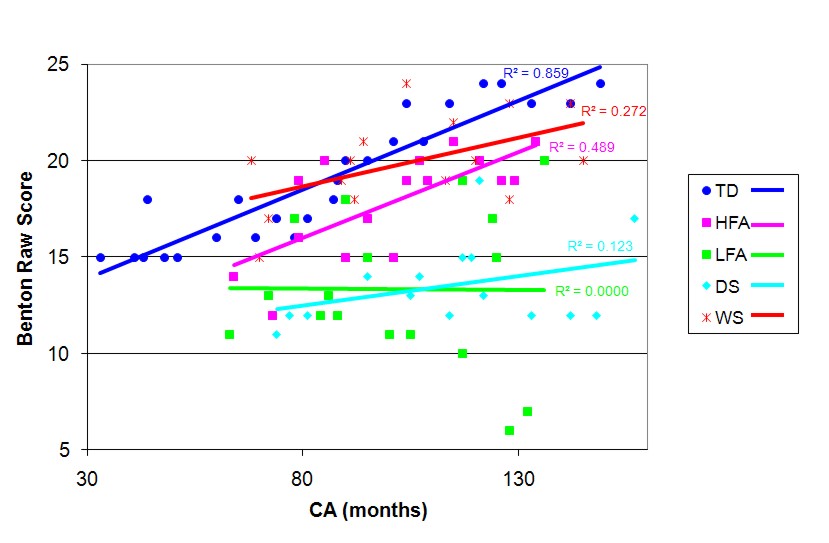
Figure 13. Mean reaction times on the part-whole task for each disorder group. [Figure not included in paper].

Document last edited by MT, 16/08/07.